Showroom Exchange helps you see how your cancellations $s are distributed so you can work on minimizing them.
Using the “Annual Sales by Month” Report, select either “cancellation $s” or “cancellation count” from “order status”. Select “cancellation $s” to see $ totals of cancellations broken up by month. Select “cancellation count” to see the number of cancellations broken up by month. With either option, you have the additional feature of being able to filter by cancellation reason.

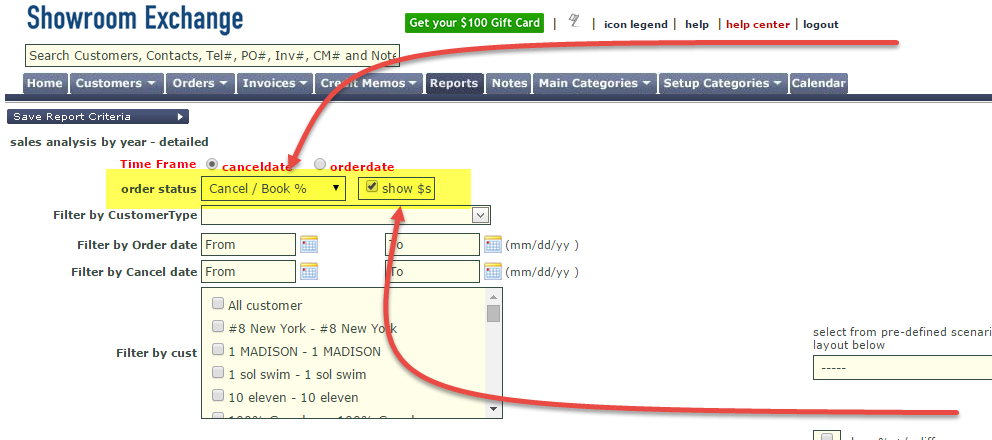
You can also select “Cancel/Book %” to see the percentage of booked sales that are cancelled/revised. You also have the option to show $s (see check-box in image below). With this option you can see the values behind a percentage. For example, 50% means $600 cancelled out of $1200 booked.
You can also use the “Sales by Mfr/Customer” or “Sales by Customer/Mfr” reports to analyze cancellation $s (see image below). Under order status, selected “cancelled.” This report is best to see summary cancellation values, or see itemized/listed specific cancellations. Annual Sales by Month is best for analysis.

From the Order tab, you may view/filter ALL cancellation records:
On the Orders tab, you can also filter by the “cancelled” column. If you don’t see this column, you can activate it with “customize this view” (http://blog.showroomexchange.com/customize-this-view/). With this method, you can filter to see how many cancellations have been made by a customer or manufacturer, how many cancellations occurred within a territory, analyze a specific $ range of cancellations, etc. You can also export or print your findings from the order tab (see below).

