Annual Sales by Month Report

The Annual Sales by Month report is a great way to analyze your sales and/or shipping metrics by month. This report is highly customize-able.

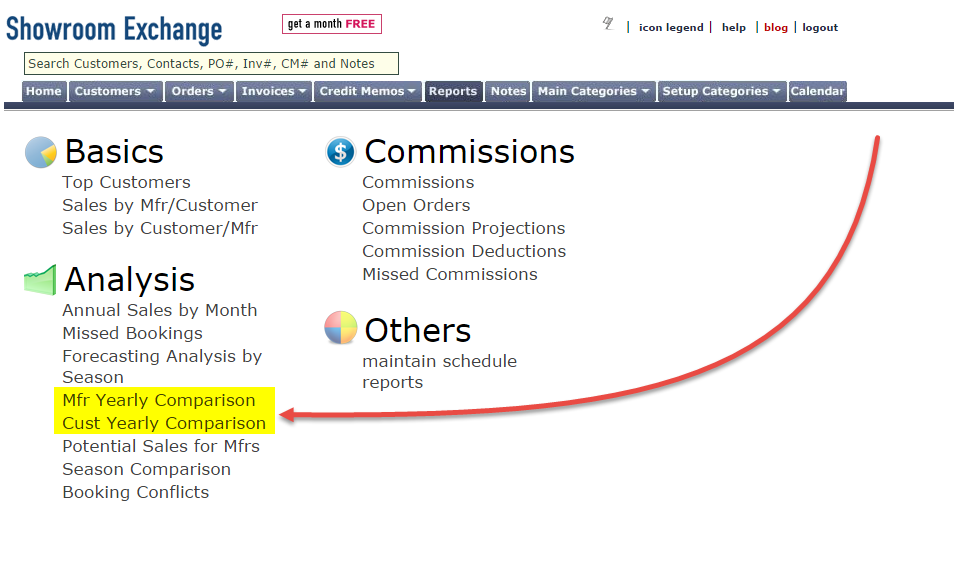
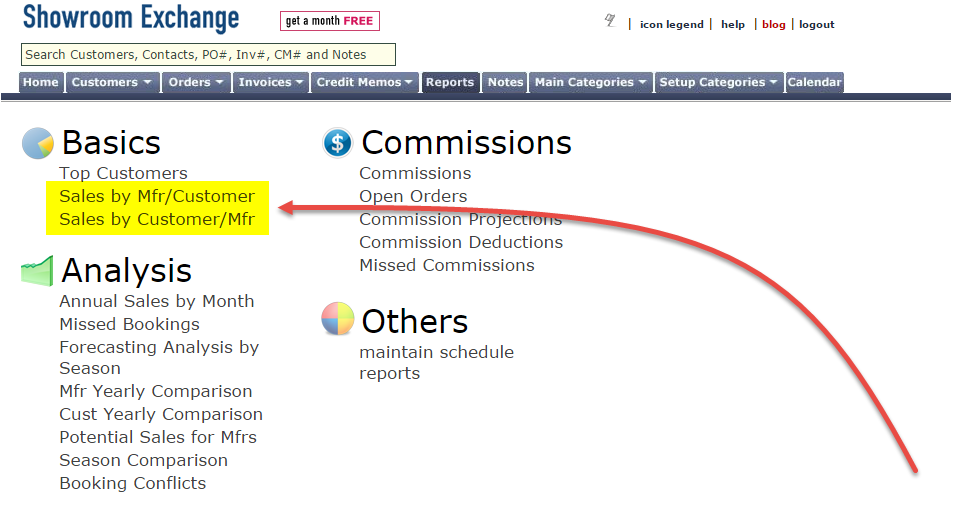
From the reports tab, as shown below (1), click “Annual Sales by Month” (2).

annual sales by month4


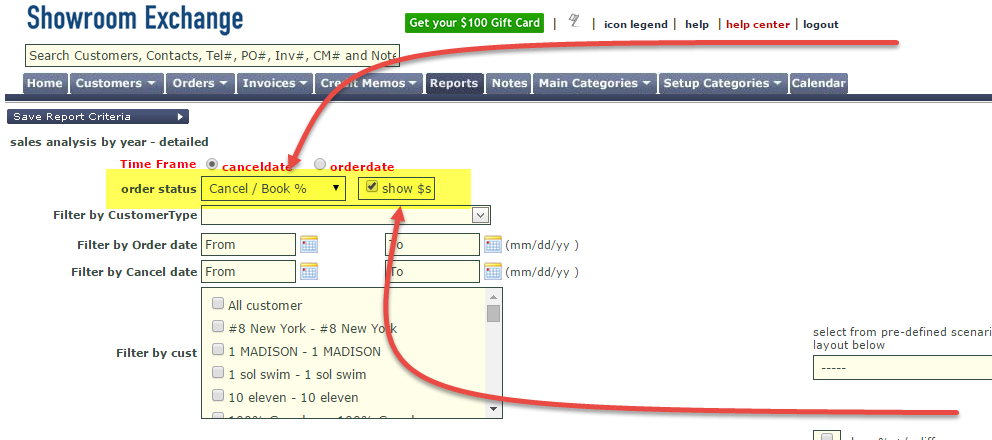
(A) As shown below, the first step is to select the time frame grouping for $s you wish to analyze. Orders have several dates assigned to them. Would you like to group $s based on their order date or cancel date?

(B) In the “order status” drop down, you can select what kind of data you wish to see in your report: active $’s, booked $’s, shipped $’s, cancellation $’s, ship/active%, etc.

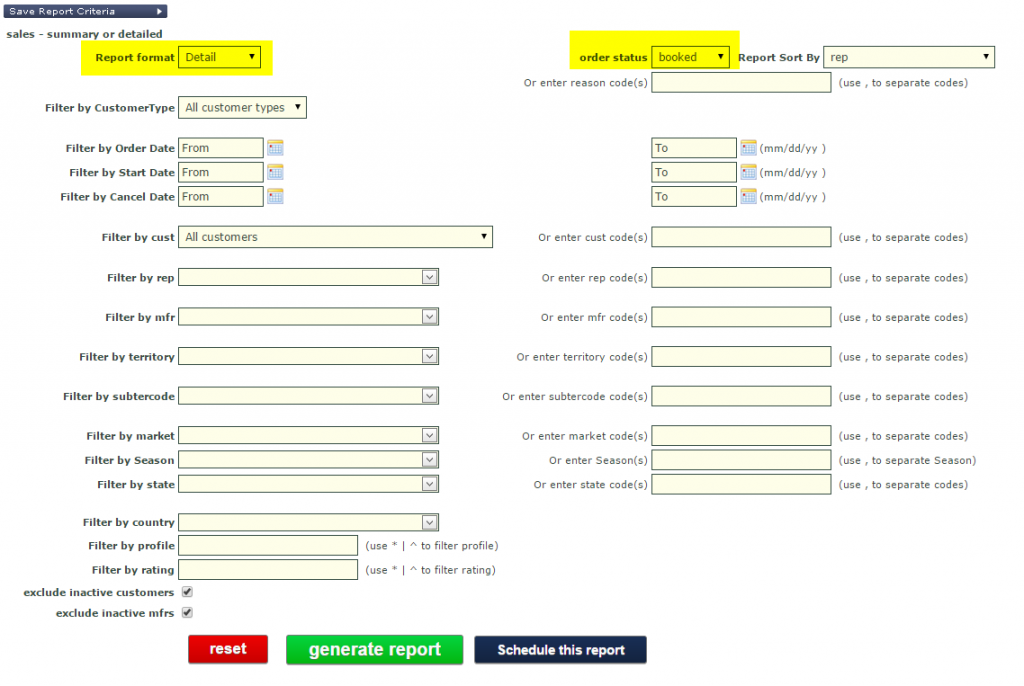
(C) The rest of the left side of the page is standard filtering as found in other reports. Use these options for altering the focus of your report to a specific subset of your data.

(D) The right side of the screen is where you choose what aspects of the data you wish to display. Check off the box under the “show” column to include the aspect in the report.
While this grid might be confusing at first, we’ve included some pre-set scenarios to start you off and help you understand the logic.
You can also select which aspect you want to sort by. For example, click the option next to customer code and under “sort” to show your results in alphabetical order by customer name.
The subtotal column allows you to see subtotals by the aspect you check off under that column. For example, see total values for each individual customer.
Check the “customer detail” box to see each customer’s contact information.
Check “show % +/- difference” to see the percentage change from month to month

annual sales by month5


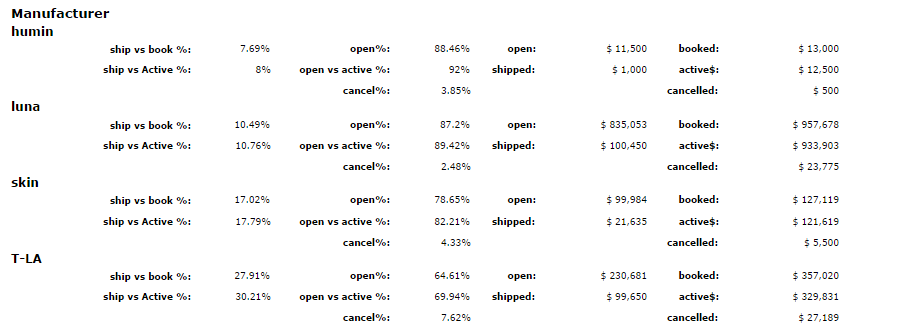
Click “generate report.” you’ll see a results page much like the one shown below. The grid is organized with the options you’ve selected as the columns on the left, with months and year totals on the right. Each row represents a specific customer/rep/territory/ etc.

We do recommend that you use the Export to Excel option for further analysis.


annual sales by month3

Cancellation Analysis

Showroom Exchange helps you see how your cancellations $s are distributed so you can work on minimizing them.

Using the “Annual Sales by Month” Report, select either “cancellation $s” or “cancellation count” from “order status”. Select “cancellation $s” to see $ totals of cancellations broken up by month. Select “cancellation count” to see the number of cancellations broken up by month. With either option, you have the additional feature of being able to filter by cancellation reason.

2014-12-15_10-46-15


You can also select “Cancel/Book %” to see the percentage of booked sales that are cancelled/revised. You also have the option to show $s (see check-box in image below). With this option you can see the values behind a percentage. For example, 50% means $600 cancelled out of $1200 booked.

cancelation analysis


You can also use the “Sales by Mfr/Customer” or “Sales by Customer/Mfr” reports to analyze cancellation $s (see image below). Under order status, selected “cancelled.” This report is best to see summary cancellation values, or see itemized/listed specific cancellations. Annual Sales by Month is best for analysis.

cancelation analysis1


From the Order tab, you may view/filter ALL cancellation records:

On the Orders tab, you can also filter by the “cancelled” column. If you don’t see this column, you can activate it with “customize this view” (http://blog.showroomexchange.com/customize-this-view/). With this method, you can filter to see how many cancellations have been made by a customer or manufacturer, how many cancellations occurred within a territory, analyze a specific $ range of cancellations, etc. You can also export or print your findings from the order tab (see below).


2014-12-15_10-08-37


export print order tab

Measure Brand Performance with Ship-Through Percentages

Once the order is booked, it’s up to your manufacturers(mfrs)/brands to credit-approve, produce and ship the goods on-time!

…So that you can receive your commission.

With the Annual Sales by Month report, you can view ship-through %s, i.e.; how completely your mfrs are shipping each month.

From the reports tab, select “Annual Sales by Month.” On the report criteria page, under “order status” select: “ship / active %”, or “ship / book %”. e.g.; $100 was booked, $90 active (due to a $10 order revision), $60 shipped, ship/booked %=60%, ship/active%=66.7%.

We find “ship / active %” to be more fair/realistic of what should actually be shipping.

If you select ship/booked% or ship/active%, you can check “show $” to see dollar values shipped along with the percentage.
Net shipping value, will take into account any negative invoice as well (e.g.; charge-backs, returned goods)

ship through percentage


Why is the Best Brand Receiving the Most Attention?

It’s not uncommon for the best performing manufacturer to take all of the attention.

  • Use manufacturer yearly comparison report to monitor booking distribution across your brands (i.e. see if all of your eggs are in one basket). Click here to see how to use the mfr yearly comparison report
  • Use the sales analysis to track ship through percentages to measure your designers manufacturing performance. Eliminate non-performing brands. Click here to see how to use the sales by mfr/customer & sales by customer/mfr reports

Compare Manufacturers’ and Customers’ Sales by Year

The manufacturer yearly comparison report and the customer yearly comparison report can examine and compare sales (for a specific period) over the last few years. Use these reports to view the ranking of custs/mfrs for each year, their % of total annual sales, their ship-thru %, and % changes between the years.

These are the perfect tools for monitoring the growth of your business, as well as the performance of your brands.

Find both the Mfr Yearly Comparison report and the Cust Yearly Comparison report on the reports tab

comparison reports3


On the Reports Criteria page, there are two important options different than the usual filters:

1. Decide if you wish to analyse sales based on order date or cancel date. Cancel date is the time frame typically used.

2. When you filter by date, the range must be within one calendar year, because that range will be analyzed in past years as well. Enter 01/01/## – 12/31/## to compare year totals, or select a smaller window of time to see how it compares to the same period in past years.

comparison reports2


The report results will show you customers or manufactures and their annual sales, breaking down each year by rank, active dollars, % of total sales, % shipping rate, and % change to the year prior.

comparison reports1

Best practices for the manufacturer yearly comparison report:

  • run this report annually to help plan your sales projections for the new year
  • compare manufacturers over the past several years to see which manufacturers have gained traction and which are falling behind

Sales by Mfr/Customer & Sales by Customer/Mfr Reports

The Sales by Mfr/Customer report and the Sales by Customer/Mfr report are simple reports that break down your sales by manufacturer or by customer.

Know which manufacturers each customer has purchased before with the Sales by Customer/Mfr report. See which customers buy for each manufacturer with the Sales by Mfr/Customer Report. Both can be found in the Basics section on the Reports tab.

sales by reports


The report criteria for these 2 reports are very similar and straightforward. With report format, select “detail” to see every order organized by mfr and customer, or select “summary” to see totals for each mfr or customer. Enter filters to make the report more specific, or don’t to see all of your sales.

Note: more often than not you will want the order status to be “active,” to show values your showroom is actually dealing with, i.e.; original booking minus any revisions, e.g.; a cancelled order.

sales by reports1


Once the report is generated, you can see every order organized by customer and manufacturer.


Example of a detailed Sales by Mfr/Customer report

sales by reports2


Example of a detailed Sales by Customer/Mfr report

sales by reports3

Commissions Report

Use the commissions report to determine what is owed to you (the showroom) and what has to be paid out to your reps. The commissions report depends on consistent entry of commission statements (as invoices in Showroom Exchange). The commission entry process is VERY important as the information is used to determine the mfr’s ship-thru %, help determine what is still left open (more on open orders report), and ultimately showroom’s total earnings.

If your brands send commission statements without a payment, just to report their shipments, you would have entered the commission statements with the invoices ‘pdate’ left blank. The same report can be used to filter “Unpaid” invoices.


commissions report1


On the criteria page, you can enter filters to create very specific reports, such as those analyzing just one rep, just the showroom, or just one manufacturer. Note that you can also filter by paid/unpaid status.

commissions report2


Click “generate report” to see the result of the commission report, like the one below. The report shows commissions broken down by rep (including the showroom rep, i.e. the showroom as a whole) and manufacturer. A summary report only shows reps and the totals of how much they made from each line, while the detailed version lists invoices with their relevant information.

commissions report3


Aiming for Zero – Open Orders Report

The open orders report lists all orders that have not yet completely shipped (i.e.; more than 1% open).

The accuracy of the open order report is dependent on the consistent entry of commission statements (as invoices in Showroom Exchange).

Maximize your revenue!
Use this regularly to followup on open orders (especially after entering commission statements).


open orders


The report criteria page of the open orders report is very similar to other reports (select the filters to define what open orders you want to see).

You can filter by how “open” an order is based on $s (i.e. $500-%1000 open) or % (i.e. over 50% open).

Couple of important noteworthy filters to consider:

“show commission calculation”
Use this check-box to let the brand know the exact commission $ amount due for an outstanding open order. Use “Open $” and “show comm for SR rep only.”

show commission calculation
“Show invoice info (detailed only)”
This is helpful to show existing invoices that you may have already entered from past commission statements.


open orders1


Click generate report to see the report result like the detailed report shown below. Detailed reports show specific PO’s that are still open, broken down by manufacturer and rep, and other relevant information about the order.

open orders2


The summary report show general shipping statistics for each brand.

open orders3


Best practices for the Open Order report:

  • run open order reports after invoice entry
  • look at orders 10%-100% open if orders >10% open are not of interest
  • catch open orders from previous months (or years) by using an earlier date, i.e. 01/01/2001
  • remove open balances that will never ship using bulk cancellation to keep your records clean


Hindsight is Definitely 20/20 – Missed Bookings Report

The missed bookings report analyzes your orders and based on your search criteria, finds customers who have missed bookings. This report is perfect for finding those customers who still need a follow up to make a sale.
Find the Missed Bookings report in the Analysis section of the Reports tab.

missed bookings1


Here are the essential steps for entering your report criteria:

1) Select the manufacturer(s) you are finding missed bookings for

2) Select if you are looking for orders based on order date or cancel date. Cancel date is the option most commonly used.

3) Enter the date range you are looking for missed bookings in. In the example below, we are looking for customers without orders between July 1st and September 30th.

4) Clarify if you are analyzing the period as a whole. This options allows you to specify if you’re satisfied with a customer placing an order for 1 of the 3 months (Jul, Aug & Sep). If so, set to “Yes.”
example: A customer has placed an order for Aug, will not appear in the report.

…or if you would like to see a booking for each month, set to “No”.
example: The same customer will appear in Jul & Sep.

5) This second date range is to help specify which customers you would like to consider. In the example below, the report will 1st pull up customers who have orders between January 1st and June 30th, and will only display those who have not placed an order between July 1st and September 30th. This date range selection helps focus on “active” customers, those with recent bookings and exclude customers that had purchased from the selected brand sometime in the not so recent past.

missed bookings2


After clicking “generate report” the results will look like the example below. Customers with missing orders are listed with their last order/cancel date and their contact info under manufacturers and date ranges.

The next step will be any combination of the following for contacting the customer:

  1. Call them.
  2. Create a note entry.
  3. Tag them for market call (if applicable).
  4. Send a personalized bulk email.


missed bookings3